In their post introducing statsd, the Etsy engineering team talks about the importance of being able to quickly go from a question (“How often does X happen?”) and turn it into a graph of X happening. To me, this latency is the heart of “devops”: how fast can you answer questions about a product to inform future development?
Being able to do this quickly presumes visibility as a first-class engineering concern. My team, the Rackspace Cloud Control Panel, uses a number of tools for operational visibility. In this post I’ll go over which tools we use, what they’re good for, and why you might want to use them (if you’re not already).
The work presented here is the result of a whole team of people over more than three years and I’m only one of those contributors. I certainly think this stuff is cool though!
Graphite and Graphiti
We use Graphite for storing and rendering time series data. I wouldn’t say Graphite’s my favorite tool operationally. Its setup can be a bit of a hassle and during a recent “from the docs” install I did ran into a number of incompatible library versions (I gisted the workarounds I needed to do on a new Ubuntu 12.04 LTS machine). However there are very few other open-source tools that give you the flexibility of Graphite and I enthusiastically recommend it.
To use Graphite, you send it timeseries metrics like the following:
production.counters.apache-n01_prod_ord.apache.response.200.count 15 1390008128
The first entry is the name of the metric, the second is the value (15), the third is the time that it was observed at (1:22:08 GMT January 18th, 2014). All our metrics contain the environment (production) and the hostname (apache-n01_prod_ord), along with information to determine what the data is measuring (here, the number of apache.response.200.count). Metrics are flushed to Graphite every minute, resetting counters to 0: the value observed at a time is the number of times that event occurred in the last minute.
The metrics get aggregated over a time range and rendered into an image by Graphite. Here’s a graph of the status codes that our Apache loadbalancer machines serve in production:
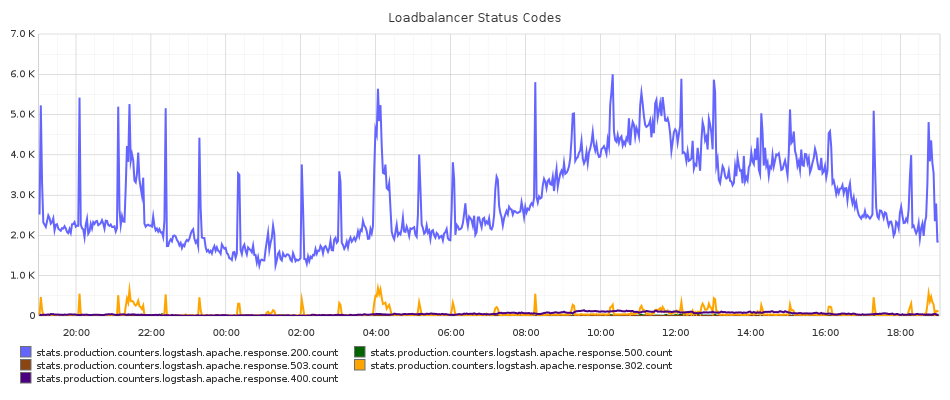
The default Graphite dashboard (a Django app) is a little unfriendly and in my opinion makes it relatively hard to create new graphs and edit existing ones. To improve this, my team uses a Graphiti install, an alternate Graphite frontend from Paperless Post. The above graph is specified through a JSON definition (most of the cosmetic options are provided by default):
{
 "options": {
    "width": 950,
    "height": 400,
    "from": "-1d",
    "fontSize": "10",
    "title": "Loadbalancer Status Codes",
    "targets": [],
    "until": "",
    "vtitle": "",
    "fontName": "DroidSans",
    "lineMode": "slope",
    "thickness": "2",
    "bgcolor": "#FFFFFF",
    "fgcolor": "#333333",
    "majorGridLineColor": "#ADADAD",
    "minorGridLineColor": "#E5E5E5",
    "yMin": "",
    "yMax": "",
    "areaMode": "",
    "hideLegend": ""
  },
  "targets": [
    [
      "production.counters.apache-n0*.apache.response.{200,500,503,302,400}.count",
      {
        "sumSeriesWithWildcards": 2
      }
    ]
  ]
}
The sumSeriesWithWildcards function takes the stat in the appropriate positions (here the 2nd position if you start counting from 0) and sums over any metric that matches them. Here it will sum over any metric reported with the apache-n0* wildcard in the 2nd place and sum over those, summing over individual hosts to giving a total sum for the entire production environment.
I’ve found the main benefit of using Graphiti together with Graphite is that if I want to make a new graph it’s as easy as clicking “Save New”, then fiddling with the JSON in a large textarea. The default Graphite interface makes this a little harder than I’d like it to be.
By providing a platform to easily create new graphs, Graphite can enable higher-level debugging patterns for system problems beyond standard sysadmin tricks like tailing logs and running advanced grep commands. While setting up a new Graphite instance on a Rackspace Performance Cloud Server I ran into an issue where the install would periodically hang and fail to load images, ultimately requiring an Apache restart. After installing our logic to send Apache stats to the Graphite backend I built a graph of apache free/idle workers. The graph proved conclusively that the mod_python setup we had been using was not releasing a certain percent of Apache workers, eventually causing the web interface to become unavailable. After updating it to use mod_wsgi the same graph proved that the issue had been fixed.
Application-Level Instrumentation with Statsd
In order to get data into Graphite, we run statsd on all of our machines. statsd listens on UDP and allows you to send data from anything that happens on the machine. For example, to gain visibility into our Python code, we use the python-statsd library.
Once this infrastructure is in place instrumenting our application code is simple. For example, here’s a query function that executes a Cassandra query:
def query(query_string, parameters=None):
    """
    Runs a query against the Cassandra cluster.

    Examples:
        statement = "SELECT * FROM songs"
        query(statement)

        statement = "INSERT INTO songs (uuid, track) VALUES (%(uuid)s, %(track)s)"
        query(statement,
              parameters={'id': uuid1(), 'track': 'Gimme Shelter'})
    """
    with statsd.timer('cassandra.query'):
        if not connection.session:
            statsd.incr('cassandra.query.session_create')
            connection.connect()

        query_statement = StatementQuery(query_string)
        with statsd.timer('cassandra.query.session_execute'):
            result = connection.session.execute(
                query_statement,
                parameters=parameters or {}
            )

        statsd.incr('cassandra.query')

        return result
This function:
- Records the time it takes the execute the entire body as
cassandra.query - Increments the
cassandra.query.session_createcounter every time a new Cassandra session is created. This should happen only once per WSGI thread. - Records the time it takes to execute the Cassandra session as
cassandra.query.session_execute. - Increments the
cassandra.querycounter every time a query is performed.
However, application instrumentation is opt-in only. It doesn’t natively allow a more cross-cutting approach (e.g. advice in Emacs Lisp, other aspect-oriented solutions). Part of me resists this sort of instrumentation as outside the responsibility of the code. What happens when you write new code – will you remember the timing and counters? Or will the code sit uninstrumented until someone is curious and needs a question answered? (But maybe that’s okay as long as you can change it fast.)
Infrastructure-Level Instrumentation with Logstash
A client-library approach like presented above can only integrate with code that you write yourself. Off-the-shelf programs that we use like Apache, MySQL, or Cassandra don’t let you hook into their code to write statsd.timing and statsd.incr calls.
In these cases we use the Logstash Agent to convert logs lines into metrics that are aggregated into Graphite. The logstash agent listens to logfiles and performs translations as log lines (“events”) occur. (The agent can be used independently of whether or not you actually ship events to a logstash server.) Logstash supports sending an event to a statsd server with the statsd output plugin. There are easily available logstash configurations for apache access logs and MySQL slow query logs.
We use the Rackspace Cloud Monitoring Agent on all our machines. When a check runs it sends all the metrics off to the Cloud Monitoring API to determine if it needs to alarm (for example, because system load is too high). While it does not yet support native statsd integration, we can get real-time CPU, memory, and load average metrics by putting put the agent into debug mode with kill -SIGUSR2 and using the Logstash agent to scrape metrics out of the logs.
Here’s an example log line for the result of a load average check:
Fri Jan 10 11:48:29 2014 DBG: 50.57.61.12:443 (hostname=agent-endpoint-ord.monitoring.api.rackspacecloud.com connID=34) -> SENDING: (endpoint:44391) => {“target”:”endpoint”,”source”:”848592c9-0130-445a-c450-bc764e111acb”,”id”:”44391”,”params”:{“timestamp”:1389354509170,”status”:”success”,”state”:”available”,”check_type”:”agent.load_average”,”metrics”:[[null,{“15m”:{“t”:”double”,”v”:”0.27”},”5m”:{“t”:”double”,”v”:”0.33”},”1m”:{“t”:”double”,”v”:”0.36”}}]],”check_id”:”ch96OT6akx”},”v”:”1”,”method”:”check_metrics.post”}
The log line is simply a JSON payload after the SENDING: (endpoint:44391) that contains the metrics associated with the agent.load_average check. Using logstash you can extract that to a field with a grok filter, parse it to JSON with a json filter, and then reference it in a statsd output. Here’s the associated logstash configuration:
input {
  file {
    'path' => '/var/log/rackspace-monitoring-agent.log'
    'type' => 'rackspace-monitoring-agent'
  }
}

filter {
  grep {
    'add_tag' => ['agent.load_average']
    'drop' => false
    'match' => ['message', 'check_type":"agent.load_average"']
    'type' => 'rackspace-monitoring-agent'
  }

  grok {
    'patterns_dir' => '/opt/logstash/agent/etc/patterns'
    'pattern' => ['message', '.*SENDING.*=> %{GREEDYDATA:raw_json_data}.*']
    'type' => 'rackspace-monitoring-agent'
  }

  json {
    'source' => 'raw_json_data'
    'target' => 'sent_data'
    'type' => 'rackspace-monitoring-agent'
  }
}

output {
  statsd {
    'gauge' => ['load_average.15m',
                '%{[sent_data][params][metrics][0][1][15m][v]}',
                'load_average.5m',
                '%{[sent_data][params][metrics][0][1][5m][v]}',
                'load_average.1m',
                '%{[sent_data][params][metrics][0][1][1m][v]}']
    'tags' => ['agent.load_average']
  }
}
While this isn’t a perfect solution (it relies on debug output), it lets us get metrics into graphite using our existing monitoring infrastructure rather than using a secondary tool such as collectd.
Using the logstash agent for metric collection lets you separate output from the actual implementation. I’d rather parse metrics from application logs (intended for human consumption) rather than litter the code with manual metric-reporting calls.
Client-Side Logging and Metrics using Socket.io
As a single-page app, our web application is primarily delivered and interacted through JavaScript executing on the client’s browser: the server is not consulted during many of the interactions that a user might perform on the site. The customer’s experience using the portal is oriented around switching between different views and opening dialogs to manage their infrasturcture. Our application servers only see the initial page load and upstream requests. This gap between experience makes it hard to gain meaningful data about customer experience from server-side logs only.
To gain more direct visibility about customer experience we ship data about client experience to our servers using socket.io (a browser-neutral Websocket interface). While socket.io can also supply a browser-push mechanism, we primarly use it to send rich data from the client to the server. A persistent Websocket connection is also a bit of a cleaner interface than making a new XMLHttpRequest for every little bit of data that needs to be transmitted, and less complicated than chunking data to send it together.
In our client-side code this looks like:
socket['emit']('log', {
  'message': 'User opened the create domain popover',
  'username': 'tildedave',
  'account_id': '123456',
  'location': '/dns',
  'user-agent': 'Mozilla/5.0 (X11; Linux x86_64) AppleWebKit/537.36 (KHTML, like Gecko) Chrome/32.0.1700.68 Safari/537.36',
  'ip': '162.242.151.76'
}
On our socket.io servers we process this message by listening on the ‘log’ topic:
var winston = require('winston');
var logger = new (winston.Logger)();
logger.add(winston.transports.Console, {
  level: settings.console_loglevel
});

socket.on('log', function (data) {
  var level = data.level;
  delete data.level;

  var message = data.message;
  delete data.message;

  logger[level](data.message, data);
});
In our server logs this gives us messages like:
2014-01-18_13:39:37.88453 info: navigating to /servers#networks category=navigation, username=tildedave, accountId=654571, isUk=false, isManaged=false, timestamp=1390052373654, location=/servers, userAgent=Mozilla/5.0 (X11; Linux x86_64) AppleWebKit/537.36 (KHTML, like Gecko) Chrome/32.0.1700.68 Safari/537.36, staticContentVersion=0b2820bcbcf3c537e6e91da730251f4244949d5a, clientIp=162.242.151.76
This lets us understand what the customer experience is – for example, if a customer submits a bug report, we can pull the logs to see if there was not only an exception from our application servers but additionally if they received any JavaScript exceptions while navigating the site.
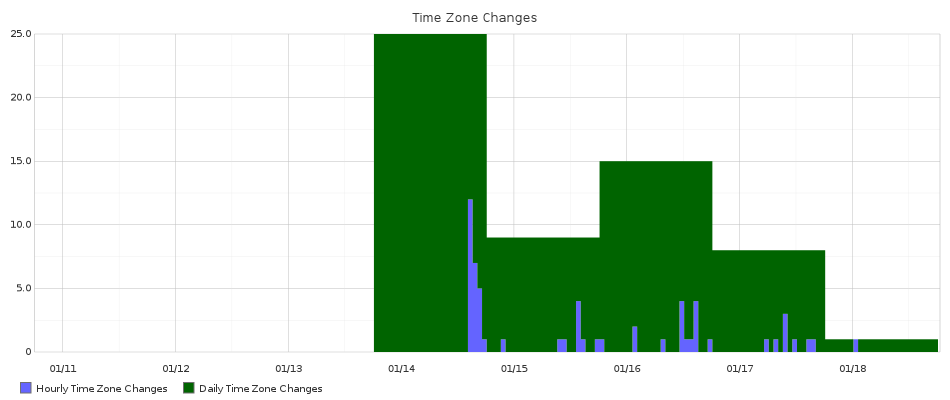
We ship metrics to socket.io in a similar fashion by providing events for counters and timers, which are then sent into Graphite through the statsd daemon running on the socket.io server. Last week we launched the ability for users to localize the times that they see in the portal and defaulted users to a time zone based on their browser setting, e.g. if you’re in New York, you see New York time. This setting can be through by changing a widget on the Account Settings page, and one of our developers set up a graph to show how often this happened.
What About Custom Dashboards?
Graphite doesn’t have the best user experience in the generated graphs: these are static images generated using the pycairo library. In constrast there are tools out there that will let you build custom dashboards on top of visualization libraries such as D3.js. Certain tools such as Cubism can pull metrics from Graphite and build really asthetically appealing custom dashboards with a little HTML/CSS/JavaScript knowledge.
However, I think custom dashboards written using HTML and JavaScript will necessarily end up static and answer only a fixed set of questions. If changing a dashboard requires JavaScript development, there is a tendency towards making someone on the team the “dashboard engineer”, especially if JavaScript is not a core technology used by the team. The concentration of knowledge necessary to change the dashboard becomes a barrier to formulating new questions about the system.
My experience has been is that as soon as I get an answer to a question, new questions immediately suggest themselves – usually because I asked the wrong question! If you can’t figure out the right questions ahead of time, it’s not going to be possible to build that perfect dashboard. While visibility enables the process of answering questions, it’s not an end in itself: it’s only as useful as the value you extract from it.
In order to do product development you need to be able to ask and answer new questions about how your application behaves. I’ve argued that this level of visibility is crucial to enable higher-level sysadmin debugging patterns. Once you have your application providing visibility into events through shipping to statsd through both application and infrastructure-level instrumentation, the main benefit that a visualization tool can give you is flexibility. Anyone can build a fixed dashboard that shows the state of today’s knowledge. It is a harder and better challenge to generate tomorrow’s knowledge.